

Understanding Software Performance Fundamentals
Software performance is a critical pillar of user experience and operational efficiency. When applications lag or consume excessive resources, it often stems from inefficient algorithms, database latency, or unoptimized memory management. Understanding the underlying network protocols and system architecture is the first step toward building resilient software. Performance is not merely about raw speed; it is about consistency and reliability under varying loads.
The Diagnostic Process: Identifying Bottlenecks
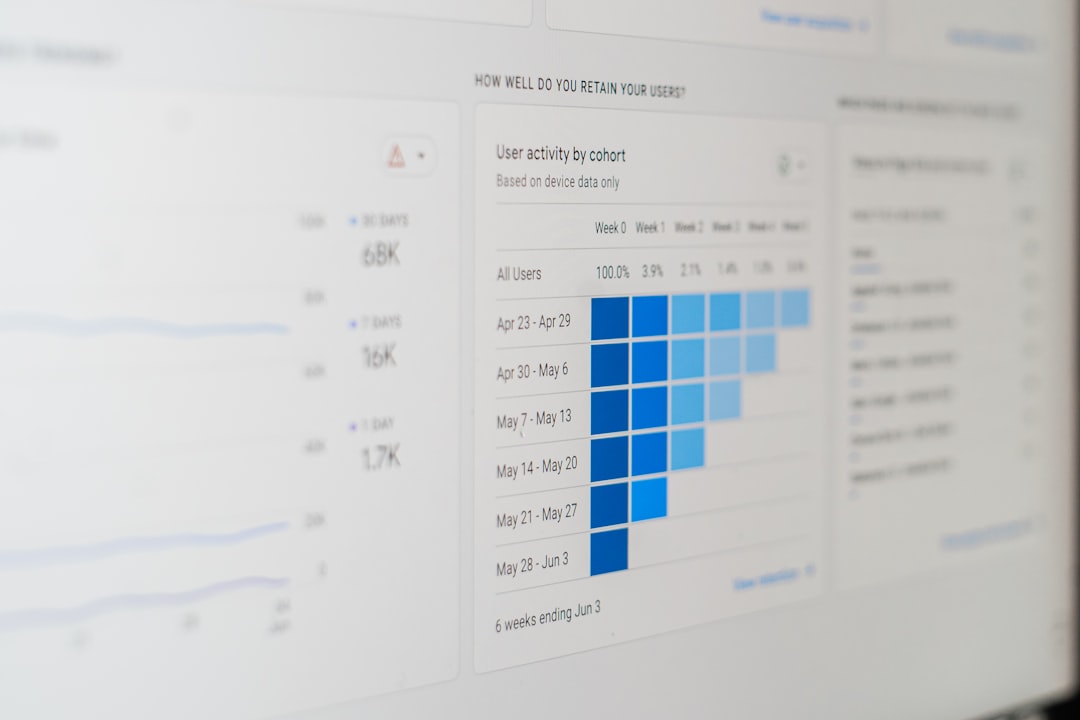
Effective diagnosis begins with observability. Without clear metrics, optimization is guesswork. Utilizing system monitoring tools allows developers to visualize CPU usage, memory leaks, and I/O wait times in real-time. By establishing a performance baseline, teams can detect deviations early. The process involves isolating the environment, analyzing logs, and running controlled benchmarks to pinpoint whether the issue lies within the application code, the database, or the infrastructure layer.
Advanced Profiling and Analysis Techniques
Profiling is the act of measuring the performance of an application by analyzing the frequency and duration of function calls. Advanced application performance monitoring (APM) solutions provide deep insights into execution traces. For instance, identifying a N+1 query problem in database interactions is a classic example of where profiling reveals hidden inefficiencies. By examining the call stack, developers can identify the specific lines of code that trigger high latency, allowing for surgical code refactoring rather than broad, untested changes.
Key Strategies for Performance Optimization
Database Optimization
Databases are frequently the primary source of performance degradation. Implementing proper indexing strategies and optimizing complex queries can drastically reduce load times. Caching mechanisms, such as Redis or Memcached, provide a layer of high-speed storage that prevents redundant calculations and minimizes database round-trips.
Memory Management
Memory leaks occur when an application fails to release memory that is no longer required. Using garbage collection tuning and analyzing heap dumps help in identifying objects that remain in memory longer than necessary. Efficient memory management ensures that the application remains stable during peak traffic hours.
Comparative Analysis of Performance Bottleneck Areas
| Bottleneck Type | Common Indicators | Primary Solution |
|---|---|---|
| Database Latency | High query execution times | Indexing and Query Optimization |
| CPU Saturation | High processor usage | Algorithmic Refactoring |
| Memory Leaks | Gradual increase in RAM usage | Garbage Collection Tuning |
| Network I/O | High latency/timeouts | CDN and Payload Compression |
Addressing Distributed Systems and Latency
In modern cloud-native environments, microservices architecture introduces network latency concerns. Services communicating over HTTP/REST may face overheads that monolithic applications do not. Utilizing asynchronous messaging patterns, such as Apache Kafka or RabbitMQ, can decouple services and improve overall system responsiveness. Furthermore, implementing load balancing ensures that traffic is evenly distributed across multiple instances, preventing any single point of failure from causing a performance bottleneck.
Frequently Asked Questions
How do I differentiate between a code-level performance issue and a server-side hardware limit?
To differentiate, analyze the resource utilization patterns. If CPU usage is consistently high despite low traffic, the issue is likely inefficient code or an unoptimized algorithm. Conversely, if the server experiences high I/O wait times or memory exhaustion specifically during traffic spikes, it indicates that the hardware capacity or infrastructure configuration is the bottleneck. Always use monitoring tools like Datadog to correlate code performance metrics with server resource consumption.
What is the most effective way to optimize database queries without rewriting the entire schema?
The most effective approach is to perform a query execution plan analysis using commands like EXPLAIN. This reveals whether the database is performing full table scans rather than index lookups. Adding composite indexes on frequently filtered columns often provides immediate results. Additionally, limiting the number of returned columns in SQL queries and implementing pagination for large datasets are high-impact, low-effort changes.
Are there automated tools to detect performance regressions during the CI/CD process?
Yes, modern CI/CD pipelines can incorporate performance testing suites. Tools like JMeter or k6 allow for automated load testing every time new code is deployed. If the response time for critical endpoints exceeds the established threshold, the build can be automatically flagged or rejected, ensuring that performance is maintained throughout the development lifecycle.
How does caching impact software performance beyond just speed?
Caching significantly reduces the load on backend services and external APIs. Beyond speed, it increases system resilience by allowing the application to serve cached data even if the primary database is momentarily unavailable or slow. It also reduces operational costs by minimizing data transfer and compute resource usage.
What are the common signs of a memory leak in a production environment?
A classic sign is a sawtooth pattern in memory usage graphs, where the memory usage gradually increases until it hits a ceiling, followed by a sudden drop (if garbage collection triggers) or an application crash (Out of Memory error). If you see a consistent, non-recoverable upward trend in memory usage that does not correlate with increased traffic, a memory leak is highly probable.
Why is asynchronous processing important for software performance?
Asynchronous processing allows the main thread of an application to continue executing while long-running tasks, such as file uploads, email sending, or data processing, happen in the background. This prevents the user interface or API from ‘blocking,’ which results in a smoother experience and higher throughput, as the system can handle multiple requests concurrently without waiting for sequential processes to finish.
Conclusion
Software performance is a continuous cycle of measurement, analysis, and refinement. By utilizing robust monitoring, focusing on database efficiency, and adopting architectural patterns like asynchronous messaging, developers can maintain high-performing systems. Consistent testing within the development lifecycle ensures that performance remains a priority, ultimately delivering a reliable, efficient, and scalable experience for all end users.
